I don’t know how I missed this. I guess feeling comfortable with the command line has its drawbacks. What’s worse, it has been 2 years since the first release on GitHub, and I only found out about it now. Zigbee2MQTT has its own Web GUI. Managing your Zigbee devices just got a lot easier! (or prettier, if you know what you are doing via SSH). Is it a game-changer? Not really, but anyone just getting into ZigBee will appreciate it!
Want to know more? Let’s discover it together.
How to enable the Zigbee2MQTT Dashboard

Despite looking mature, the dashboard feature is still marked as experimental, so use it with caution. Back up all your Zigbee2MQTT settings and be prepared to restore your mesh network from scratch if something goes wrong.
Once your data is safe and sound, you will need to enable the Zigbee2MQTT web interface. In the documentation, this is called the Frontend. First, stop Zigbee2MQTT and open the configuration.yaml file. The front end has to be enabled:
#stop z2m service
sudo systemctl stop zigbee2mqtt

#edit configuration file
nano /opt/zigbee2mqtt/data/configuration.yaml
Add the following lines to the bottom of the .yaml file (remember YAML files are sensitive to indentation).
frontend:
  port: 8080
By default, the Zigbee2MQTT dashboard is available at port 8080 but you can change this to your preference. Save the file (Ctrl+X, Y) and restart your Zigbee2MQTT service:
sudo systemctl start zigbee2mqtt
If all went well, you can access your brand-spanking new dashboard at http://your_ip:8080.
What can you do in Zigbee2MQTT Dashboard?

After browsing all available options, I honestly can’t think of anything that wouldn’t be available on this frontend. Even more advanced settings, which I never had to change, were accessible via web GUI.
If you were tired (like me) of managing your devices and features via the command line, you can now do all that via web interface – an especially useful option if you are trying to find the Id of the device you just paired.
The main Zigbee2MQTT Dashboard is split into the following panels:
- Devices
- Dashboard
- Map
- Settings
- Groups
- OTA
- Touchlink
- Logs
- Extensions
My only criticism at this point is the dropdown menu which toggles pairing mode for ZigBee devices. For whatever reason, Permit pairing more is on a 5 min timer and it will time out keeping your network secure from stray ZigBee devices.
Devices

This tab lists all devices bound to your coordinator. You can manage each device (rename/reconfigure/delete) from this screen as well as get basic information about the device and see the battery levels at glance. The devices panel comes with a search option to quickly find the devices you are after.
Dashboard

The dashboard is a more advanced look at your devices on the network. Instead of device information, each card exposes possible interactions and data coming from each device. For relays and switches, you will see toggles to control these remotely (some need to be pressed once to get the initial status) and for sensors the data streams back to your coordinator.
Sadly, cards can’t be arranged in custom orders, but the search bar is present for quick-find options.
Map

The map panel displays mesh visualisation. It’s a great screen to understand how your network is propagated and identify device types (end devices/routers). Links between nodes will display the connection type and strength so you can understand your network better.
Settings

This tab brings typical coordinator and Zigbee2MQTT settings. You will find options to export your configuration files, change the YAML settings, control blocklists and more. A lot of options here are ways to edit and modify your configuration.yaml file via the web interface.
This menu also holds the shortcut to External Converters. If your device isn’t supported by default, you can add your converter through this menu.
Groups

This section is self-explanatory. You can add/edit and delete groups in your ZigBee Mesh network.
OTA

This panel checks the firmware present on your ZigBee devices and allows you to update the firmware (if available).
Touchlink

I actually have no idea what Touchlink devices are. I have one in my network at the time of the writing so I’ll send you to the official documentation.
Logs
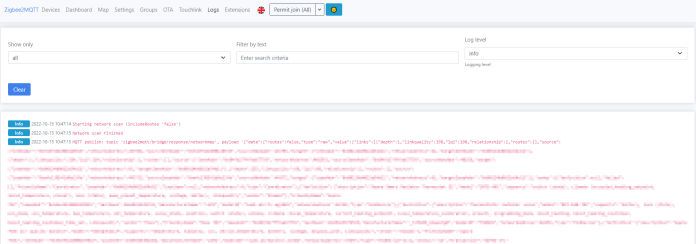
If you are used to looking at logs via:
sudo journalctl -u zigbee2mqtt.service -fNow you can access this information from the Log panel. Small colour-coded tags will make it easier to look for errors and find the info at glance. Additionally, you can set the logging levels – a handy feature if you are trying to figure out new converters.
Extensions

Lastly, if you are really into Zigbee2MQTT and you have interesting scripts, you can add these via extensions.
Final Thoughts
I love this! It saves me time from actually making my own NodeRED-based interface (something I had in mind for some time). If you already know about this, and you are reading this – why you haven’t said anything to me? If you are like me, surprised by this interface – you are welcome! And while we are at it, I have just been told TasmoAdmin exists, so I’m going to explore that now. Let me know what you think in this Reddit thread.


