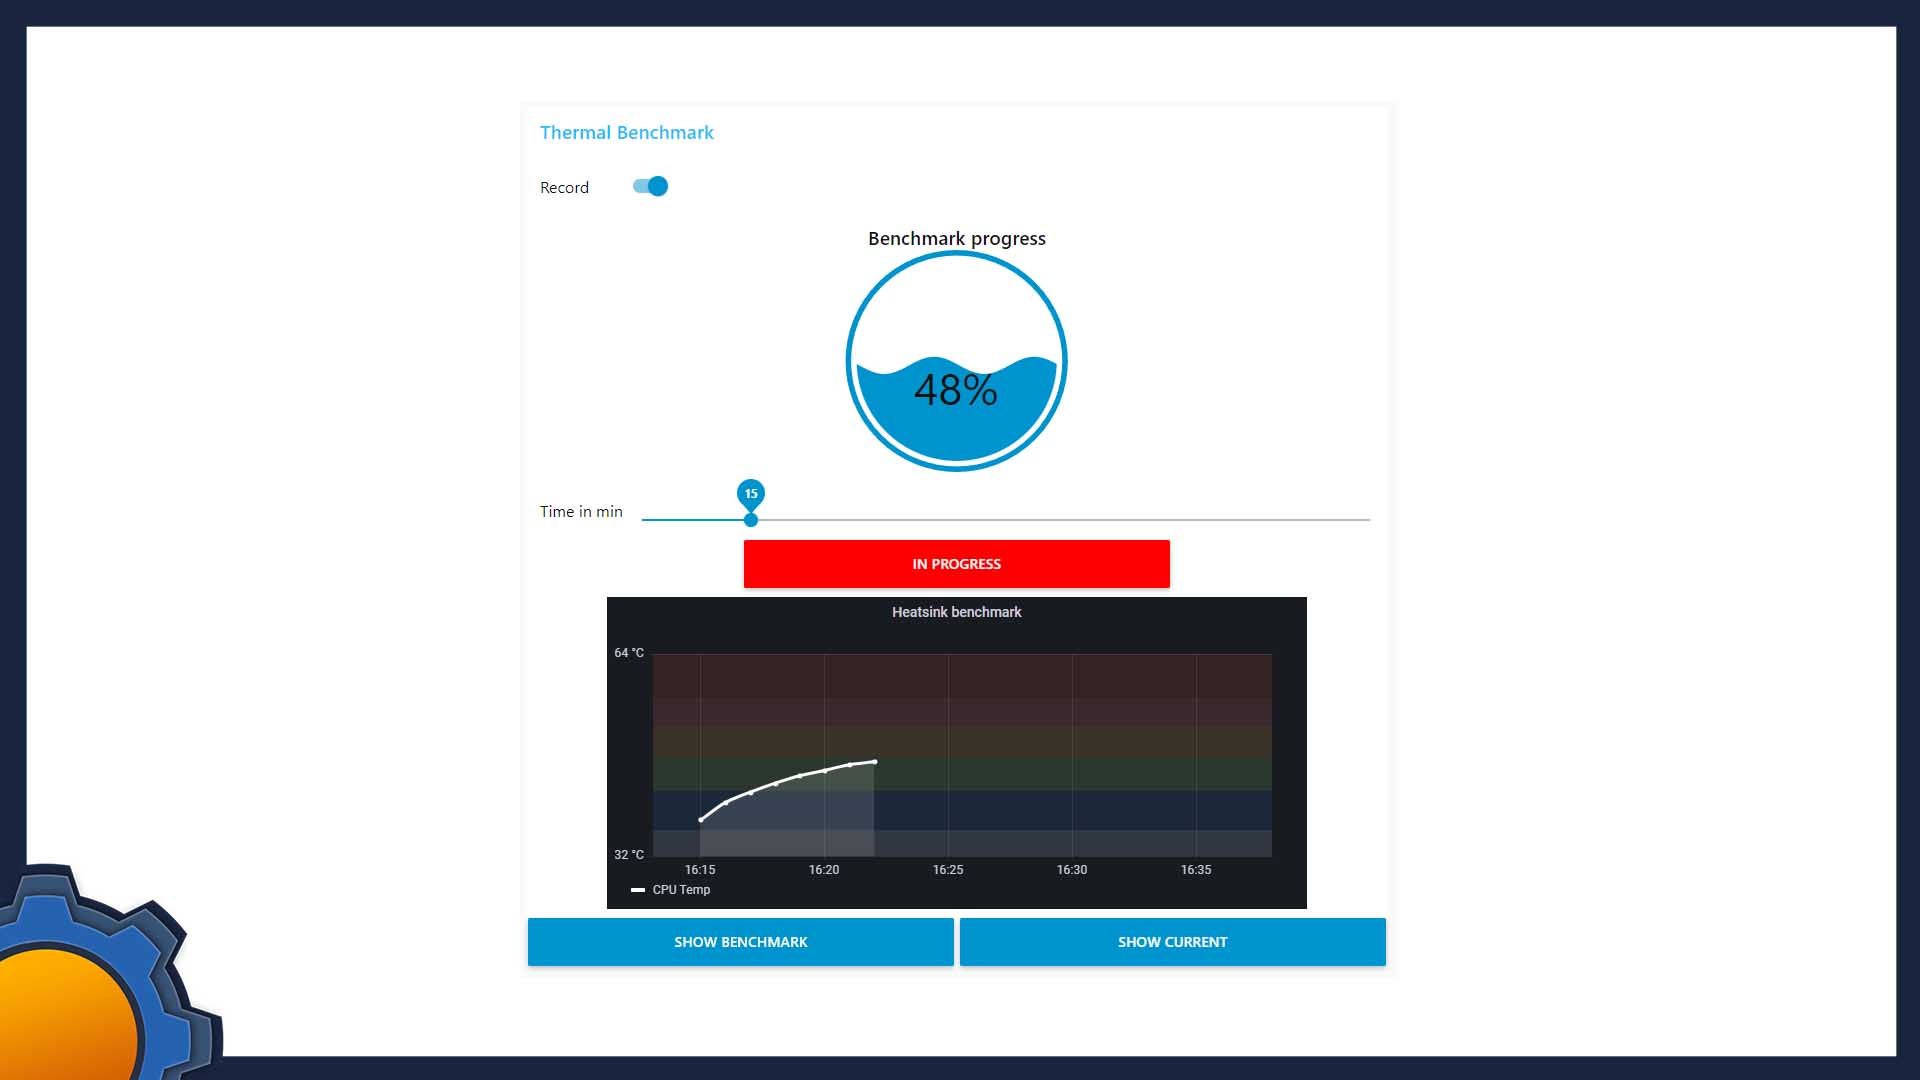
I very much doubt this will attract a lot of attention, but I made a small NodeRED tool that will help me out in future thermal testing of the boards and enclosures. It gave me an opportunity to work with the dashboard in NodeRED and play a little more with Grafana and InfluxDB integration.
About the flow

The project is split into 3 sections that work together to stress the CPU and record the temperature of the CPU. Then it plots a graph thanks to Grafana and InfluxDB which will show either period of interest (the benchmark) or a bigger chunk of data (in case you want to see how the cooling solution dissipates the heat.
All this is wrapped in a dashboard interface where you can define the time of your benchmark and monitor the progress. Feel free to look under the hood to learn how I tackled it.
You will need:
- Grafana
- InfluxDB
- apt-get install stress
- NodeRED with following nodes:
node-red-contrib-cpu
node-red-contrib-influxdb
node-red-dashboard

Data logging
I used my Grafana & InfluxDB guide to set up a database which makes it super easy to chart the data your way and display it in many useful ways. The data from the CPU (sent every second) is stopped if the recording option isn’t enabled in the dashboard. Otherwise, the temperature and CPU load is logged in InfluxDB. I decided to log both in case I want to use CPU data for something else or show the idle stats.
Benchmarking
The exec node has the ability to run a command in the command line. It uses stress command and re-formatted timeout with the payload set by the slider from the dashboard. It specifies the number of seconds the test should last.
sudo stress --cpu 4 --timeout 60Upon completion, a payload is sent to the 1st and the 3rd output of the log which completes the benchmark and sets the UI in motion.
UX

Most of my time, I spent on the interface, as I wanted to have the access to the following information on a single screen: progress, timeout and usable graph that I can just screenshot into my articles.
In my design, I log the start of the test, and the duration set by the slider. These values alongside hardcoded offset (2 min) before and after the test are used to trim my Grafana graph to only show the benchmark period. This works in advance as well thanks to Grafana being able to take the from-to timestamps into the future.
Later on, I added the ability to extend that graph to the current time as well. The embedding is explained in the Grafana and InfluxDB guide.
Another notable improvement is the gauge which shows the percentage of the test. As the duration of the test will change each time, I opted out for a second based ticker which divides the 100% completion by total duration time in seconds and updates the UI accordingly. I store the current progress of the test in the context store and append it accordingly.
var progress= context.get("progress");
var progress_now = progress + 100/(timeout*60);
context.set ("progress", progress_now);
if (progress_now >= 100){progress_now = 100;}
msg.payload = Math.round(progress_now);
With a bit of clever interconnecting, I was able to refresh various elements (labels and colours) and change the button texts, colours and make it all look neat.
Possible changes
I could add a table of past results to the mix, which would load the graphs based on the entry selected, but this would work best when the database and grafana aren’t hosted on the same machine. This way, the deployment time would be quicker, and results would be available across different testing scenarios.
This will require a way to invoke tags (and the ability to tag individual tests) as you go to load the database. I will consider implementing this change sometime in the future.
Final thoughts
It would take about 10-15 min to set everything up on a fresh RaspbianOS installation, which may seem like a lot, but the changes to the process I used in the past, make it worthwhile. Feel free to re-use all or some of that for your use – especially if you are curious how to set a percentage progress bar that can be used for a lot of different things. If you have any ideas or suggestions feel free to leave them in this Reddit thread or the GitHub project.

Project Download
Download project files here. Bear in mind that Patreon supporters have early access to project files and videos.


